Grafana
Grafana is a multi-platform open-source analytics and interactive visualization web application. It provides charts, graphs, and alerts for the web when connected to supported data sources.
Similar to Dynatrace, Grafana can be used to monitor and visualize data from various sources.
Deploy Loki
First We need to deploy Loki, and Tempo to our local cloud.
Loki is a horizontally-scalable, highly-available, multi-tenant log aggregation system inspired by Prometheus. It is designed to be very cost-effective and easy to operate. It does not index the contents of the logs, but rather a set of labels for each log stream.
Lets start by making a folder for our loki service
mkdir -p ~/local-cloud/loki
cd ~/local-cloud/loki
Now we can create a docker-compose.yml file to start our loki instance.
networks:
  proxy:
    external: true

services:
  loki:
    image: grafana/loki:2.8.0
    container_name: loki
    hostname: loki
    restart: unless-stopped
    volumes:
      - ./config.yml:/etc/loki/config.yml
    networks:
      - proxy
    command: -config.file=/etc/loki/config.yml
    labels:
    - "traefik.enable=true"
    - "traefik.http.routers.loki.rule=Host(`loki.localhost`) || Host(`loki.dev.localhost`)"
    - "traefik.http.routers.loki.entrypoints=web,websecure"
    - "traefik.http.routers.loki.tls=true"
    - "traefik.http.routers.loki.service=loki@docker"
    - "traefik.http.services.loki.loadBalancer.server.port=3100"
For storage we will use Minio if not yet deployed you can follow the Minio guide.
Now lets make the config file for loki
~/local-cloud/loki/config.yml
auth_enabled: false

server:
  http_listen_port: 3100
memberlist:
  join_members:
    - loki:7946
schema_config:
  configs:
    - from: 2021-08-01
      store: boltdb-shipper
      object_store: s3
      schema: v11
      index:
        prefix: index_
        period: 24h
common:
  path_prefix: /loki
  replication_factor: 1
  storage:
    s3:
      endpoint: minio:9000
      insecure: true
      bucketnames: loki-data
      access_key_id: automation
      secret_access_key: supersecret
      s3forcepathstyle: true
  ring:
    kvstore:
      store: memberlist
ruler:
  alertmanager_url: http://localhost:9093
  storage:
    s3:
      bucketnames: loki-ruler
Now we can start our loki service
docker compose up -d
Deploy Tempo
Next we need to deploy Tempo, a high-scale distributed tracing backend.
It will also store traces in Minio.
Lets start by making a folder for our tempo service
mkdir -p ~/local-cloud/tempo
cd ~/local-cloud/tempo
Now we can create a docker-compose.yml file to start our tempo instance.
networks:
  proxy:
    external: true

services:
  tempo:
    container_name: tempo
    hostname: tempo
    image: grafana/tempo:latest
    command: "-target=scalable-single-binary -config.file=/etc/tempo.yaml"
    volumes:
      - ./tempo.yml:/etc/tempo.yaml
    restart: always
    networks:
      - proxy
    ports:
      - 3450:3200
    labels:
    - "traefik.enable=true"
    - "traefik.http.routers.tempo.rule=Host(`tempo.localhost`) || Host(`tempo.dev.localhost`)"
    - "traefik.http.routers.tempo.entrypoints=web,websecure"
    - "traefik.http.routers.tempo.tls=true"
    - "traefik.http.routers.tempo.service=tempo@docker"
    - "traefik.http.services.tempo.loadBalancer.server.port=3200"
Now we can make the config file for tempo
tempo.yml
server:
  http_listen_port: 3200

distributor:
  receivers:                           # this configuration will listen on all ports and protocols that tempo is capable of.
    otlp:
      protocols:
        http:
        grpc:
    zipkin:
    jaeger:
      protocols:
        thrift_http:
        grpc:
        thrift_binary:
        thrift_compact:

ingester:
  max_block_duration: 5m               # cut the headblock when this much time passes. this is being set for demo purposes and should probably be left alone normally

compactor:
  compaction:
    block_retention: 1h                # overall Tempo trace retention. set for demo purposes

memberlist:
  abort_if_cluster_join_fails: false
  bind_port: 7946
  join_members:
  - tempo:7946


metrics_generator:
  registry:
    external_labels:
      source: tempo
      cluster: docker-compose
  storage:
    path: /tmp/tempo/generator/wal
    remote_write:
      - url: http://prometheus:9090/api/v1/write
        send_exemplars: true

storage:
  trace:
    backend: s3                        # backend configuration to use
    wal:
      path: /tmp/tempo/wal             # where to store the the wal locally
    s3:
      bucket: tempo                    # how to store data in s3
      endpoint: minio:9000
      access_key: automation
      secret_key: supersecret
      insecure: true
      # For using AWS, select the appropriate regional endpoint and region
      # endpoint: s3.dualstack.us-west-2.amazonaws.com
      region: us-east-1

querier:
  frontend_worker:
    frontend_address: tempo:9095

overrides:
  metrics_generator_processors: ['service-graphs', 'span-metrics']
Note the service configs use the root user we created in the Minio guide.
Now we can start our tempo service
docker compose up -d
Deploy Grafana
Now that we have Loki and Tempo deployed we can deploy Grafana.
If prometheus is not deployed you can follow the Prometheus guide.
Lets start by making a folder for our grafana service
mkdir -p ~/local-cloud/grafana
cd ~/local-cloud/grafana
Now we can create a docker-compose.yml file to start our grafana instance.
networks:
  proxy:
    external: true

volumes:
    data:

services:
  grafana:
    container_name: grafana
    hostname: grafana
    image: grafana/grafana-oss:main
    restart: unless-stopped
    networks:
      - proxy
    volumes:
      - ./datasources.yml:/etc/grafana/provisioning/datasources/datasources.yml
      - data:/var/lib/grafana
    environment:
      - OTEL_EXPORTER_OTLP_PROTOCOL=http/protobuf
      - OTEL_EXPORTER_OTLP_ENDPOINT=http://otelcol:4318
      - GF_LOG_LEVEL=debug
      - GF_AUTH_ANONYMOUS_ENABLED=true
      - GF_AUTH_ANONYMOUS_ORG_ROLE=Admin
      - GF_AUTH_DISABLE_LOGIN_FORM=false
      - "GF_FEATURE_TOGGLES_ENABLE=ssoSettingsApi extraThemes lokiExperimentalStreaming"
      - GF_DIAGNOSTICS_TRACING_ENABLED=true
      - GF_DIAGNOSTICS_PROFILING_ENABLED=true
      - GF_DIAGNOSTICS_PROFILING_ADDR=0.0.0.0
      - GF_DIAGNOSTICS_PROFILING_PORT=8080
      - GF_DIAGNOSTICS_TRACING_FILE=/tmp/trace.out
      - GF_PATHS_DATA=/var/lib/grafana
      ## Run in container
      # grafana cli --insecure plugins install grafana-image-renderer
      # - GF_INSTALL_PLUGINS=grafana-piechart-panel grafana-image-renderer
    labels:
    - "traefik.enable=true"
    - "traefik.http.routers.grafana.rule=Host(`grafana.localhost`) || Host(`grafana.dev.localhost`)"
    - "traefik.http.routers.grafana.entrypoints=web,websecure"
    - "traefik.http.routers.grafana.tls=true"
    - "traefik.http.routers.grafana.service=grafana@docker"
    - "traefik.http.services.grafana.loadBalancer.server.port=3000"
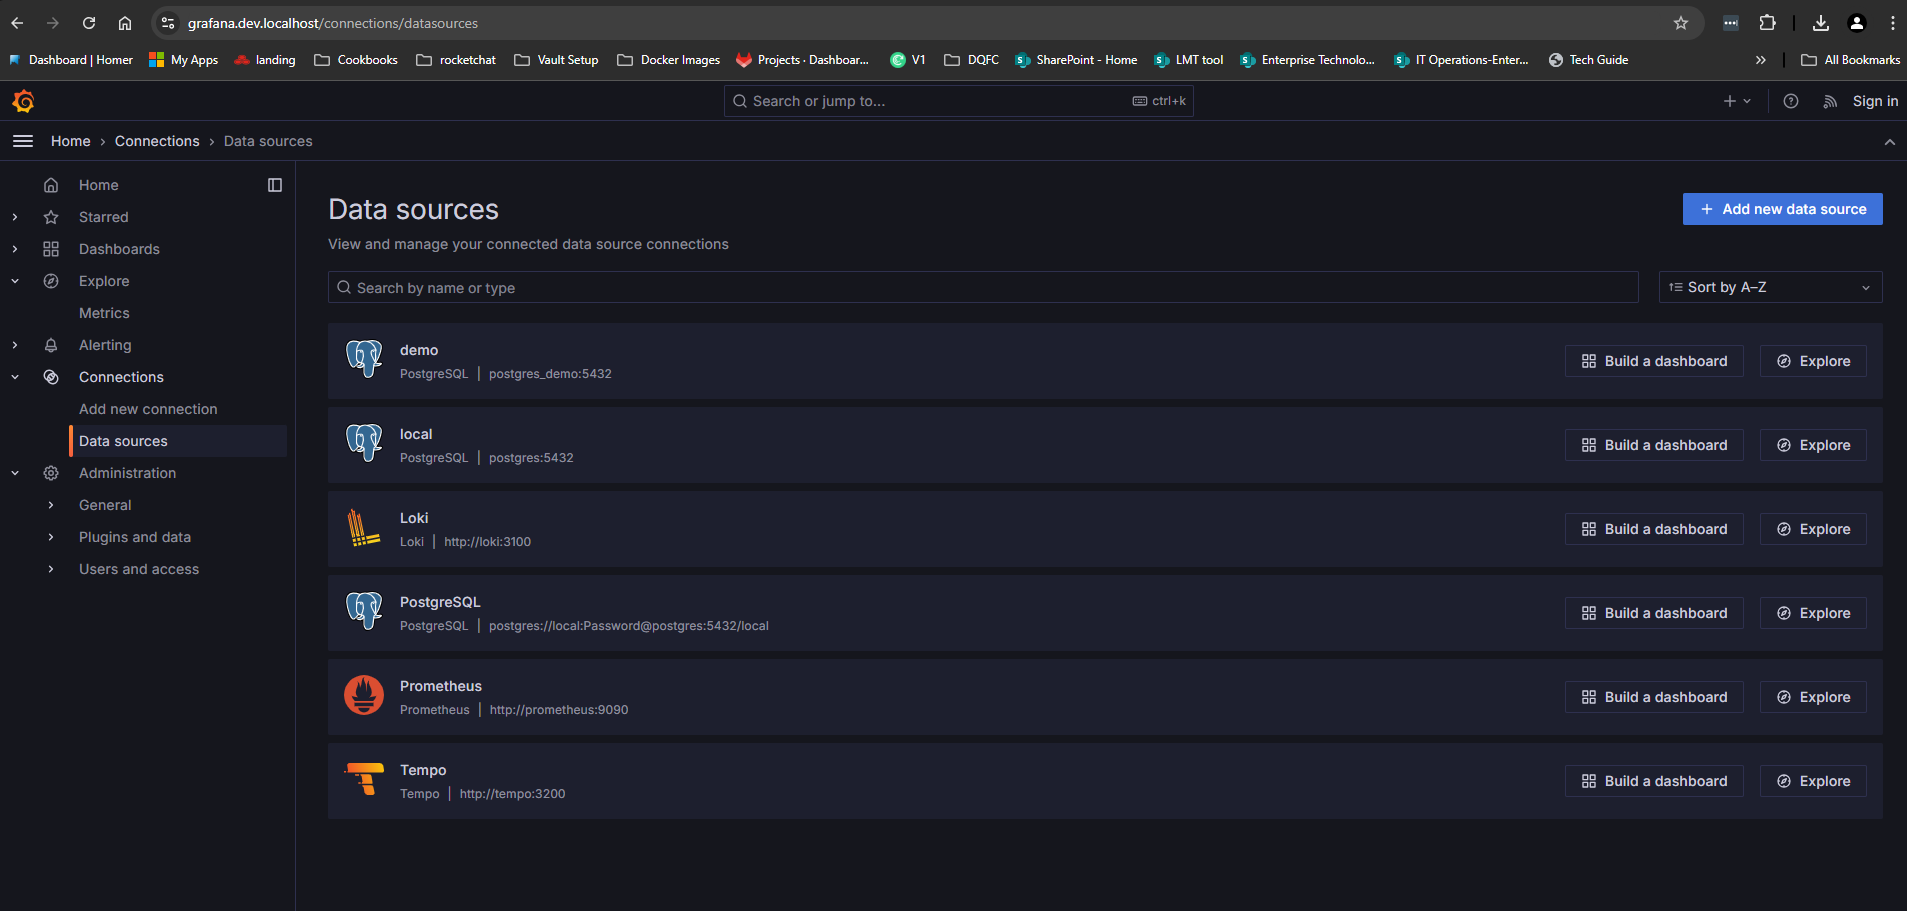
Now we are going to create a datasource for Grafana to use. this will be used to connect to Prometheus, Loki and Tempo.
apiVersion: 1

datasources:
  - name: Prometheus
    type: prometheus
    uid: prometheus
    access: proxy
    orgId: 1
    url: http://prometheus:9090
    basicAuth: false
    isDefault: false
    version: 1
    editable: false
    jsonData:
      httpMethod: GET
  - name: Tempo
    type: tempo
    access: proxy
    orgId: 1
    url: http://tempo:3200
    basicAuth: false
    isDefault: true
    version: 1
    editable: false
    apiVersion: 1
    uid: tempo
    jsonData:
      httpMethod: GET
      serviceMap:
        datasourceUid: prometheus
  - name: Loki
    type: loki
    access: proxy
    uid: loki
    url: http://loki:3100
    jsonData:
      maxLines: 1000
Now we can start our grafana service
docker compose up -d
Now you can access Grafana at http://grafana.localhost
Feel free to add datasources in file or ui
